
The account wasn't underperforming. It was under-measuring.
Wimpole Fillers is a UK premium aesthetic supplies brand, selling professional-grade dermal fillers, mesotherapy products and clinical skincare to licensed practitioners across the UK, USA, Canada and the EU. High-ticket, heavily regulated, and running on WooCommerce.
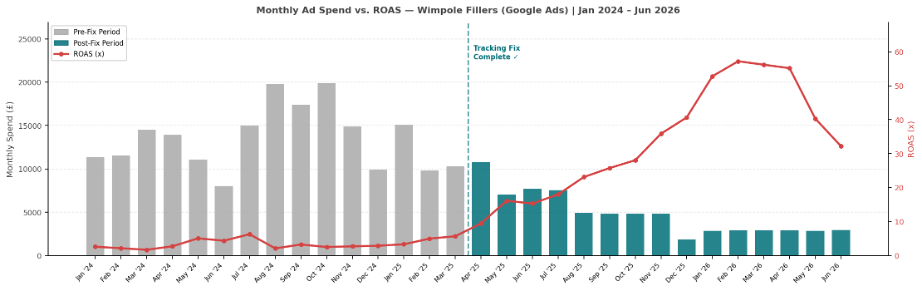
Same months, one year apart.
The cleanest way to read this account is to compare identical months across two years — which removes seasonality and any argument about attribution windows.
Aug–Nov 2025 against the same months in 2024.
Roughly £4,800 a month where £15,000–£20,000 used to go.
Down 53% once the algorithm was optimising on complete data.
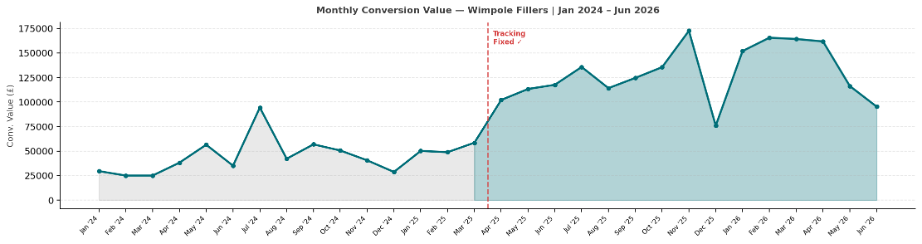
November 2025, from £4,813 of spend. The prior November: £40,697 from £14,871.
Broken conversion tracking, invisible from the dashboard.
Purchases were severely under-reported
The Google tag wasn't reliably firing on the WooCommerce checkout, so only a fraction of completed orders were being recorded. Every number in the account was built on a partial picture, and nothing on the surface said so.
Smart bidding was starved of data
Performance Max and Shopping need conversion volume to exit learning mode. With most purchases missing from the signal, campaigns plateaued, never optimised properly, and burned budget getting nowhere.
£11,000–£20,000 a month with no path to scale
Reported CPA looked high at £27.98 and reported ROAS looked weak at 3.13x. The account looked mediocre and nobody could tell whether that was the truth or the tracking.
Fix the measurement first. Then everything else becomes possible.
Phase 1 — Tracking overhaul (Jan–Feb 2025)
Enhanced Conversions activated for privacy-safe first-party matching. The WooCommerce purchase event rebuilt to fire reliably on every order confirmation. Every conversion cross-checked against WooCommerce order data until the two sources agreed. Confirmed clean by February 2025.
Phase 2 — Structure and hypothesis testing (Mar–Jun 2025)
PMax rebuilt with signals segmented by market and product tier. Standard Shopping split by performance tier. Dynamic Search Ads launched for US long-tail coverage at an average £1.72 CPC. Dedicated brand campaigns per market defending high-intent queries at £0.10–£0.67 a click.
Phase 3 — Cutting spend, not revenue (Jul 2025 – Jun 2026)
Non-brand search campaigns that were cannibalising budget without incremental return were paused. Monthly spend came down from the £15,000–£20,000 range to £2,900–£4,900 — while revenue kept climbing. Product feed titles, descriptions and images refined continuously against product-level ROAS.
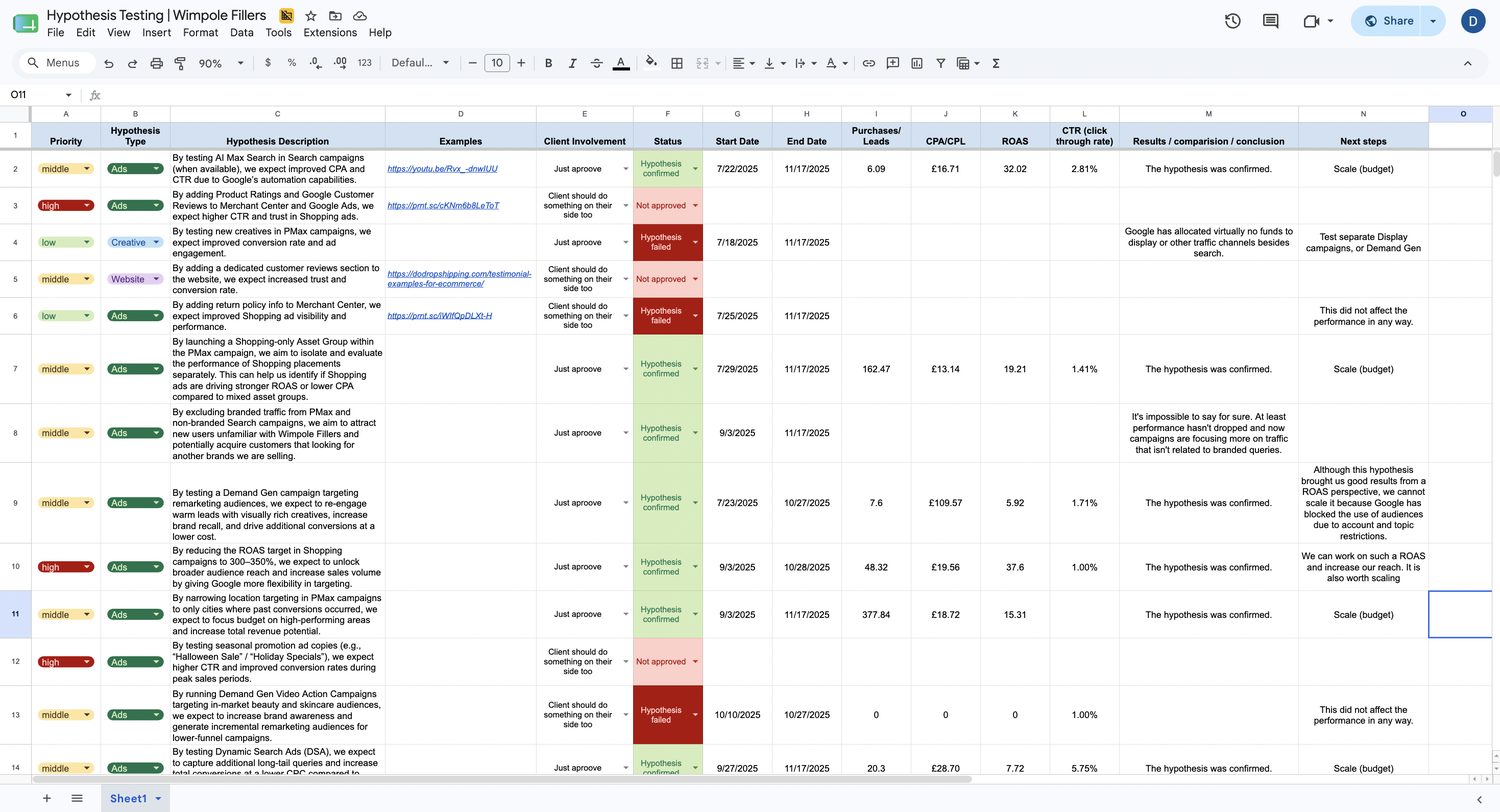
Every decision was a documented hypothesis.
Campaign type, bid strategy, product segmentation, targeting — each change was written down as a hypothesis with defined success criteria, run to a fixed end date, then marked confirmed or failed with the numbers attached. Roughly a third of them failed. Those get recorded too, because that's what stops the same idea being retried in six months.
Before and after the fix.
The dashed line on both charts marks April 2025, when tracking was confirmed clean and complete.
Monthly ad spend vs ROAS
Monthly conversion value
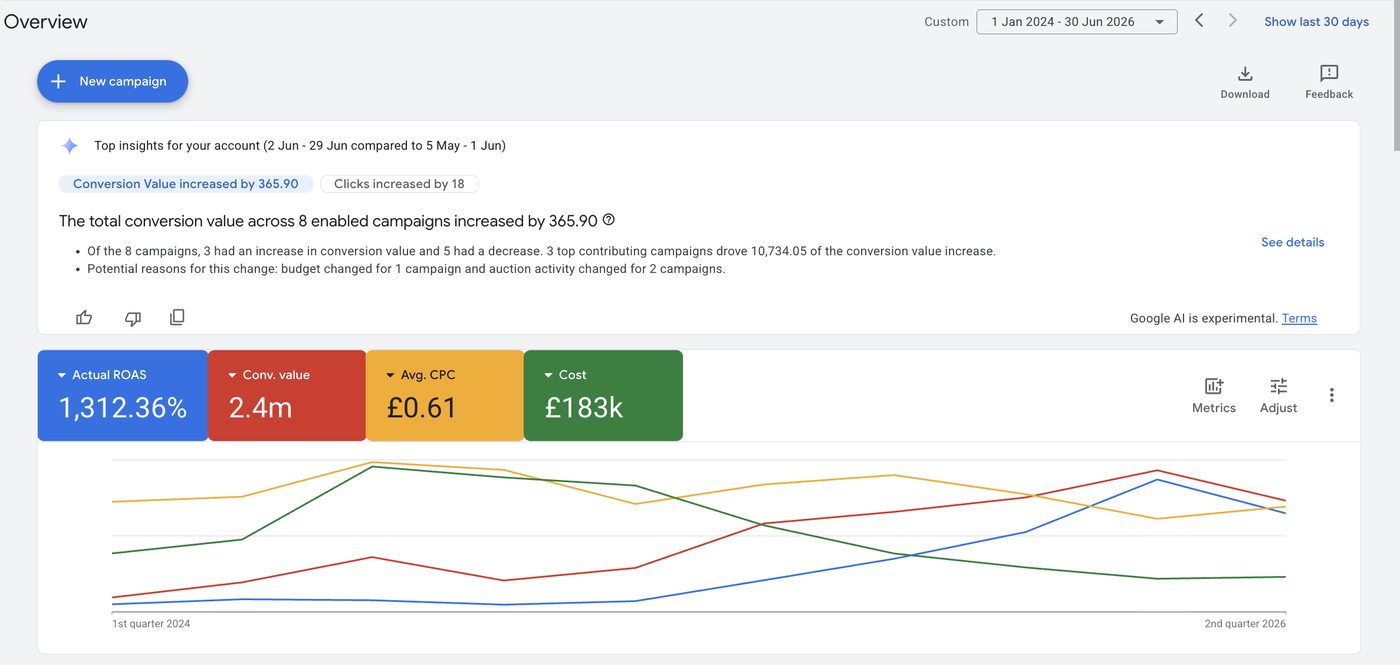
Google Ads account overview
Where the gain actually came from.
Some of it is measurement, and we'll say so
The pre-fix ROAS of 3.13x was recorded by a broken pixel, so it understated what the account was really doing. Comparing it directly to post-fix numbers would overstate the improvement. The honest claim isn't that performance multiplied overnight — it's that the account was flying blind, and once it could see, both the bidding and the budget decisions got dramatically better.
The spend reduction is not a measurement artefact
Monthly spend fell from £15,000–£20,000 to under £5,000, and revenue rose in absolute terms over the same period. That comparison holds regardless of what the old tracking was or wasn't capturing.
Brand campaigns flatter the averages
Branded search converts at extraordinary rates by definition — one brand campaign in this account shows a return in the hundreds of multiples on a few hundred pounds of spend. It's real revenue, but it isn't incremental growth, and we don't present blended account ROAS as though it were.