
One catch-all campaign became 25. Revenue grew 18.7% on 4.7% more spend.
Caden Lane sells personalised baby and children's products — blankets, gowns, pajamas and newborn gifts — direct to consumer in the US. They were already spending $244k a month on Google. All of it ran through a single Pmax campaign.
Twelve months, year on year.
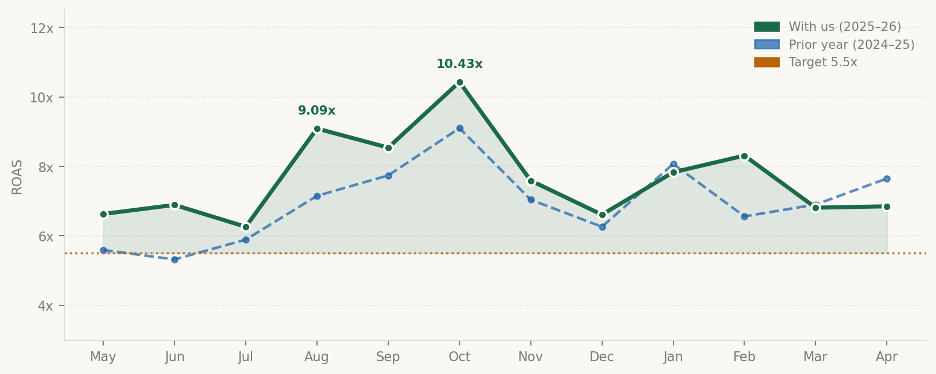
Against a 5.5x target. Every single month cleared 6.2x.
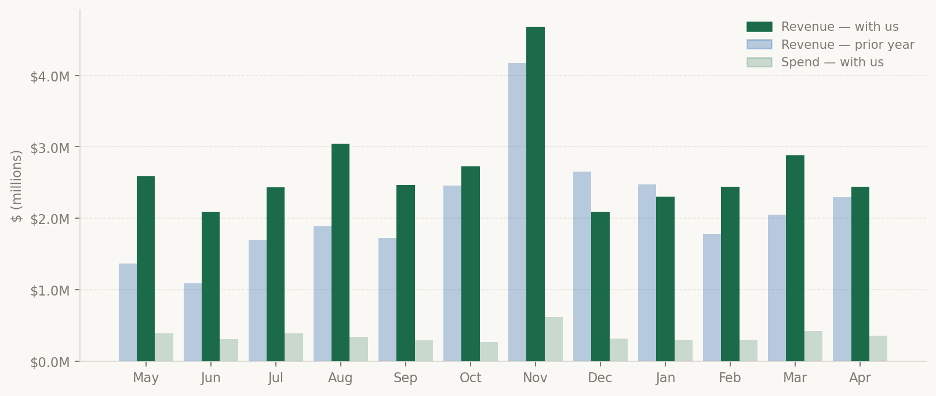
Up $5.4M, or 18.7%, year over year.
$3.89M to $4.07M. Almost all of the growth came from efficiency, not budget.
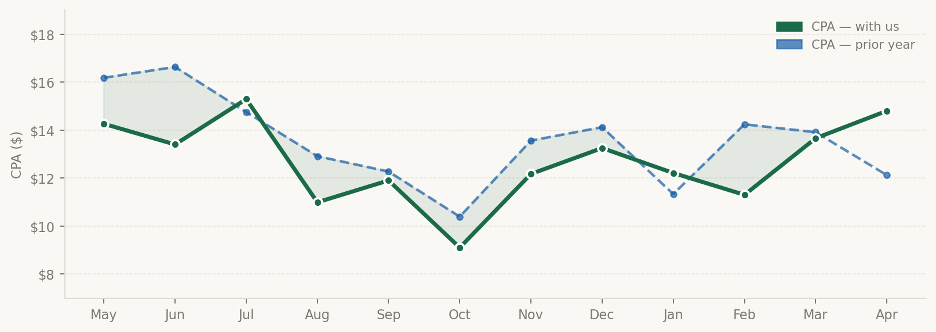
Down 11%, while volume rose 13.8% to 338k conversions.
Serious budget, no structure underneath it.
$244k a month in one catch-all Pmax campaign
No product segmentation, no brand exclusions, no category-level control. Google decided where the money went, and nobody could see which categories were carrying the account and which were quietly draining it.
CPA at $16.18 with no tROAS anchors
Without a profitability target per product line, scaling was guesswork. More budget might mean more profit or more waste, and there was no way to know in advance which.
No seasonal infrastructure at all
Black Friday, Mother's Day, 4th July — every peak in the calendar ran through the same always-on structure, with no dedicated budget and no dedicated strategy. The biggest revenue days of the year were being handled like ordinary Tuesdays.
Rebuilt the account around how the business actually sells.
Replaced the catch-all with 7 segmented evergreen campaigns
Gifts, Gowns & Footies, Colorable, Blankets & Personalised, Pajamas, Organic, New Products — each with brand exclusions and its own tROAS target between 300% and 450%. Every category could finally be judged, funded and scaled on its own numbers.
Built a full seasonal calendar — 17 dedicated campaigns
Black Friday alone got three campaigns at a 500% tROAS target. Mother's Day, Memorial Day, 4th July, Father's Day, Labor Day, Halloween, Birthday Sale, Valentine's Day, Easter, Swim and Patriotic each got their own. Built ahead of time, run hard through the peak, paused after.
Added a Demand Gen and YouTube layer
Eight campaigns covering top of funnel on YouTube Shorts, mid-funnel retargeting, bottom of funnel on Colorable, and product-specific awareness — bringing new demand into the account rather than just harvesting what was already there.
Added Shopping campaigns for SKU-level segmentation
Low Volume SKU, best-sellers with a no-change bid, Custom Label 0 and Newborn Clothes, capturing long-tail demand the Pmax campaign had been leaving on the table.
Scaled spend deliberately, month by month
$390k a month at launch, up to $617k at the Black Friday peak, never dropping below a 6.2x ROAS floor. Budget followed proven performance instead of leading it.
Twelve months of it, month by month.
ROAS — month by month vs prior year
Revenue vs spend — month by month
Cost per conversion — with us vs prior year
The peaks stopped being ordinary days.
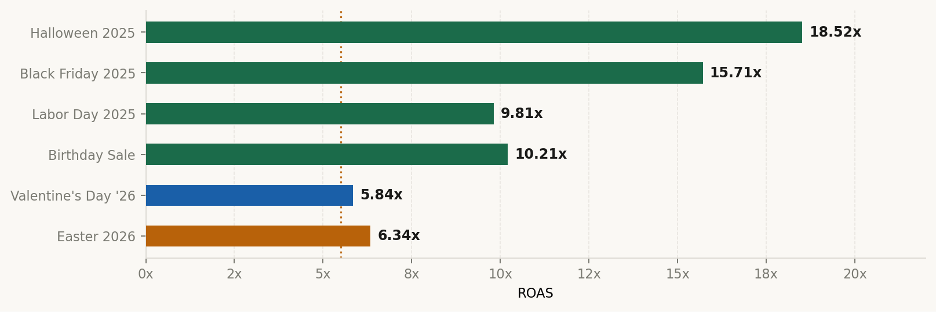
$1.69M revenue from $107k spend, across 3 campaigns.
$109k revenue from $5.9k spend.
$135k revenue from $13.8k spend.
$83.7k revenue from $8.2k spend.
$336k revenue from $53k spend.
$612k revenue from $104.9k spend.
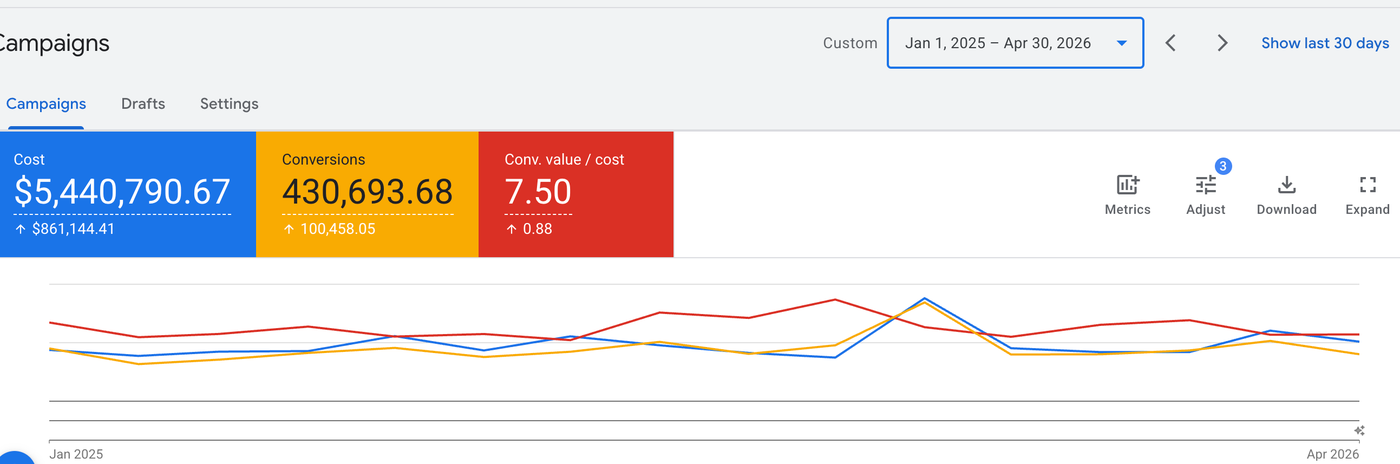
Straight from the account.
Let's find out where your funnel is leaking.
Thirty minutes. We'll go through your ads, your site and your email setup, and tell you the three things we'd fix first — whether or not you end up working with us.
No pitch deck · No obligation · Month to month, always